WHAT YOU NEED TO KNOW| SEE THE COUNTRY THAT HAS THE SIZE OF THE SMALLEST BOMB THAT CAN DESTROY HALF OF THE WORLD. US, RUSSIA ISN’T ON THE LIST.Over the past 27 years (1999–2025), Nigeria’s government spending has surged to ₦232.55 trillion, with President Bola Tinubu’s proposed ₦49.74 trillion 2025 budget contributing significantly to this total. ...Tap To Read The Full Story Here | ..Tap To Read The Full Story Here...
This cumulative expenditure, equivalent to approximately $667.89 billion based on official exchange rates, marks a dramatic increase in Nigeria’s fiscal outlay. However, when assessed using parallel exchange rates, the total falls below $500 billion.
Despite this massive financial outlay, Nigeria’s development indicators show a troubling lack of significant progress, particularly in education, housing, maternal health, and poverty alleviation, raising questions about the effectiveness of these funds in improving the lives of ordinary Nigerians.
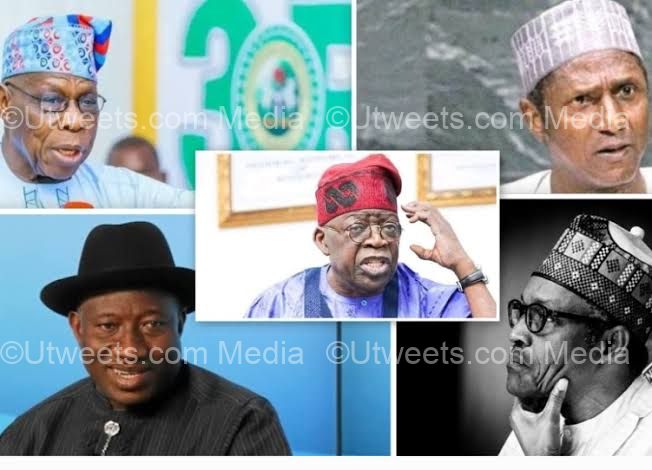
Breakdown of Expenditures by Administration
- Olusegun Obasanjo (1999–2007):
During his two terms, Obasanjo allocated ₦12.33 trillion ($121.35 billion), accounting for 5.3% of the total 27-year budget. This figure includes the budget inherited from General Abdulsalami Abubakar. - Umaru Musa Yar’Adua (2007–2010):
Yar’Adua spent ₦10.95 trillion ($79.13 billion) over his 1,071 days in office, which represents 4.71% of the total budget. - Goodluck Jonathan (2010–2015):
Jonathan oversaw ₦25.30 trillion ($156.57 billion) in spending, or 10.88% of the total amount. - Muhammadu Buhari (2015–2023):
Buhari’s government allocated ₦97.02 trillion ($228.64 billion), the largest share, accounting for 41.72%. This total includes a supplementary ₦574.53 billion in 2015. - Bola Tinubu (2023–2025):
In just 17 months, Tinubu has already spent ₦37.33 trillion. The proposed ₦49.74 trillion for 2025 would bring his administration’s total expenditure to ₦86.97 trillion ($81.98 billion), or 37.4% of the total spending during this period.WHAT YOU NEED TO KNOW| SEE THE COUNTRY THAT HAS THE SIZE OF THE SMALLEST BOMB THAT CAN DESTROY HALF OF THE WORLD. US, RUSSIA ISN’T ON THE LIST.
Political Party Spending
- People’s Democratic Party (PDP):
₦48.56 trillion ($257.07 billion) over 16 years. - All Progressives Congress (APC):
₦183.99 trillion ($310.82 billion) over 11 years.
Developmental Outcomes
Despite the significant increases in budgetary allocations, Nigeria has seen minimal improvement in key developmental areas, as illustrated by the following:
- Education:
The number of out-of-school children rose from 7.02 million in 1999 to 18.3 million in 2024, according to UNESCO. - Maternal Mortality:
The Maternal Mortality Ratio (MMR) doubled from 289 deaths per 100,000 live births in 1999 to 576 per 100,000 in 2024, according to UNICEF, making Nigeria the fourth-highest in maternal mortality globally. - Housing:
The housing deficit grew from 10.27 million units in 1999 to 28 million units by 2023, with a need for 700,000 new homes annually. - Poverty:
The number of Nigerians living in multidimensional poverty surged from 83.3 million in 1999 to 133 million in 2023.
While life expectancy improved marginally from 46.61 years in 1999 to 62.2 years in 2024, and the infant mortality rate decreased from 75 deaths per 1,000 live births in 1999 to 53.67 in 2024, these modest gains underscore a troubling lack of meaningful advancement in other areas of public welfare, despite the large budgets.
Summary of Key Development Indicators:
- Out-of-School Children: 7.02 million (1999) → 18.3 million (2024).
- Maternal Mortality Ratio: 289/100,000 (1999) → 576/100,000 (2024).
- Housing Deficit: 10.27 million units (1999) → 28 million units (2023).
- Multidimensional Poverty: 83.3 million (1999) → 133 million (2023).
- Life Expectancy: 46.61 years (1999) → 62.2 years (2024).
- Infant Mortality Rate: 75 deaths/1,000 births (1999) → 53.67 deaths/1,000 births (2024).
Annual Budgetary Allocation (1999–2025)
- 1999: ₦407 billion ($18.59 billion)
- 2000: ₦702 billion ($8.16 billion)
- 2001: ₦1.318 trillion ($13.31 billion)
- 2002: ₦1.0648 trillion ($9.77 billion)
- 2003: ₦1.45 trillion ($12.72 billion)
- 2004: ₦1.3 trillion ($10.24 billion)
- 2005: ₦1.8 trillion ($14.01 billion)
- 2006: ₦1.88 trillion ($14.63 billion)
- 2007: ₦2.39 trillion ($19.92 billion)
- 2008: ₦2.74 trillion ($23.03 billion)
- 2009: ₦3.049 trillion ($21.03 billion)
- 2010: ₦5.16 trillion ($34.4 billion)
- 2011: ₦4.972 trillion ($33.15 billion)
- 2012: ₦5.0386 trillion ($32.93 billion)
- 2013: ₦4.987 trillion ($31.17 billion)
- 2014: ₦5.23 trillion ($32.67 billion)
- 2015: ₦5.6425 trillion ($29.67 billion)
- 2016: ₦6.061 trillion ($30.74 billion)
- 2017: ₦7.441 trillion ($24.4 billion)
- 2018: ₦9.12 trillion ($29.9 billion)
- 2019: ₦8.92 trillion ($29.25 billion)
- 2020: ₦10.59 trillion ($29.42 billion)
- 2021: ₦14.573 trillion ($38.45 billion)
- 2022: ₦17.908 trillion ($43.66 billion)
- 2023: ₦24.007 trillion ($55.1 billion)
- 2024: ₦35.055 trillion ($43.82 billion)
- 2025 (Proposed): ₦49.74 trillion ($33.16 billion)
- Total (1999–2025): ₦232.546 trillion ($667.89 billion)WHAT YOU NEED TO KNOW| SEE THE COUNTRY THAT HAS THE SIZE OF THE SMALLEST BOMB THAT CAN DESTROY HALF OF THE WORLD. US, RUSSIA ISN’T ON THE LIST.
While Nigeria’s budgetary spending has increased significantly over the years, its developmental challenges persist, indicating the need for more efficient management and allocation of resources to improve the well-being of its citizens..…Tap To Read The Full Story Here.


